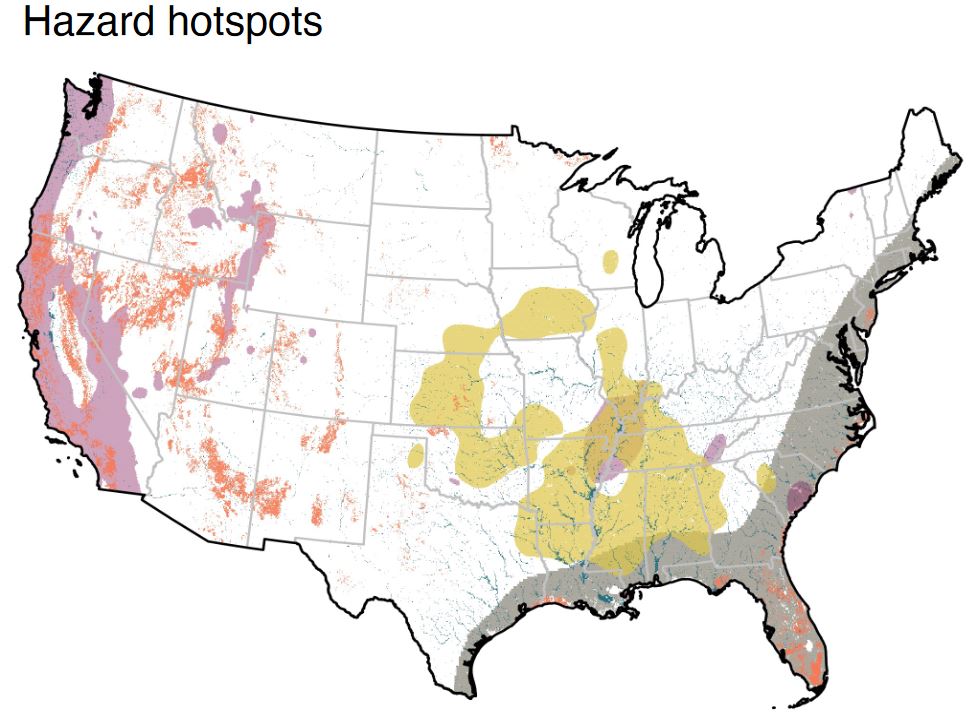
Nature has hazard zones. Earthquakes, fires, floods, etc. They existed before we got here. Then we got here and made some worse. In the US, 57% of structures are in hazard zones covering earthquakes, fires, floods, tornadoes, and hurricanes. We’ve made some areas worse for ourselves by building into fragile areas like shorelines, remote terrain, and across fault lines. Much of that growth began before we understood such issues. Now, we are unlikely to move cities and towns out of those zones. We have also been moving to warmer climates, shorelines, and into rural areas increasing our personal exposure, and society’s exposure to very expensive emergency response efforts. Mitigation efforts are frequently much cheaper, but it is difficult to know which fault area, tornado path, or waterway to prioritize for protection. We should expect increasing costs to manage the mismatch between the world we built, and the world as it was and as we’ve changed it.

Pingback: Data That Matters July 2021 | Pretending Not To Panic